2. Light Curves
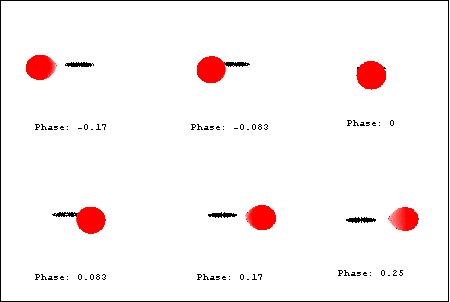
Figure 7.
Some CV systems are inclined in such a way that an eclipse occurs. In such a case, the CV revolves around the center-of-mass of the system, and during eclipse, the light from the accretion disk is blocked by the secondary star. Since most of the visible light originates from the disk, this results in a dramatic decrease in the light observed from earth. If brightness is plotted versus time, a light curve can be generated.
Graphic created using Mathematica 4.2.
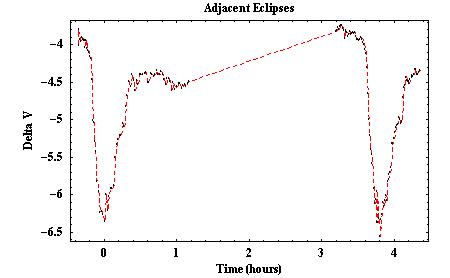
Figure 8.
CCD photometry can be used to determine the orbital periods of CV systems. The light curve above shows two adjacent eclipses approximately 3.8 hours apart, which reveals the orbital period of this CV to be about 3.8 hours. The above graph has some data points missing. Even though the data points are missing, it is evident that between the end of one eclipse and the onset of the next eclipse, there is a brightening of the system. This brightening actually begins just before the second eclipse and is due to the line-of-sight view of the hot-spot.
Graphic created using Mathematica 4.2.
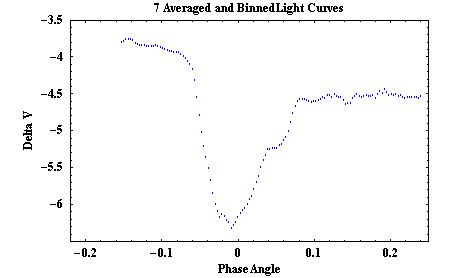
Figure 9.
Computers can average several light curves to reveal the structure of the eclipses. Sudden changes in the shape of a light curve may indicate that a prominent feature has just been eclipsed or has just emerged from the eclipse. The locations of these features is an important piece of information that can be used to determine some of the physical parameters of eclipsing CV systems. These contact points can help establish the geometry of the system.
Graphic created using Mathematica 4.2.