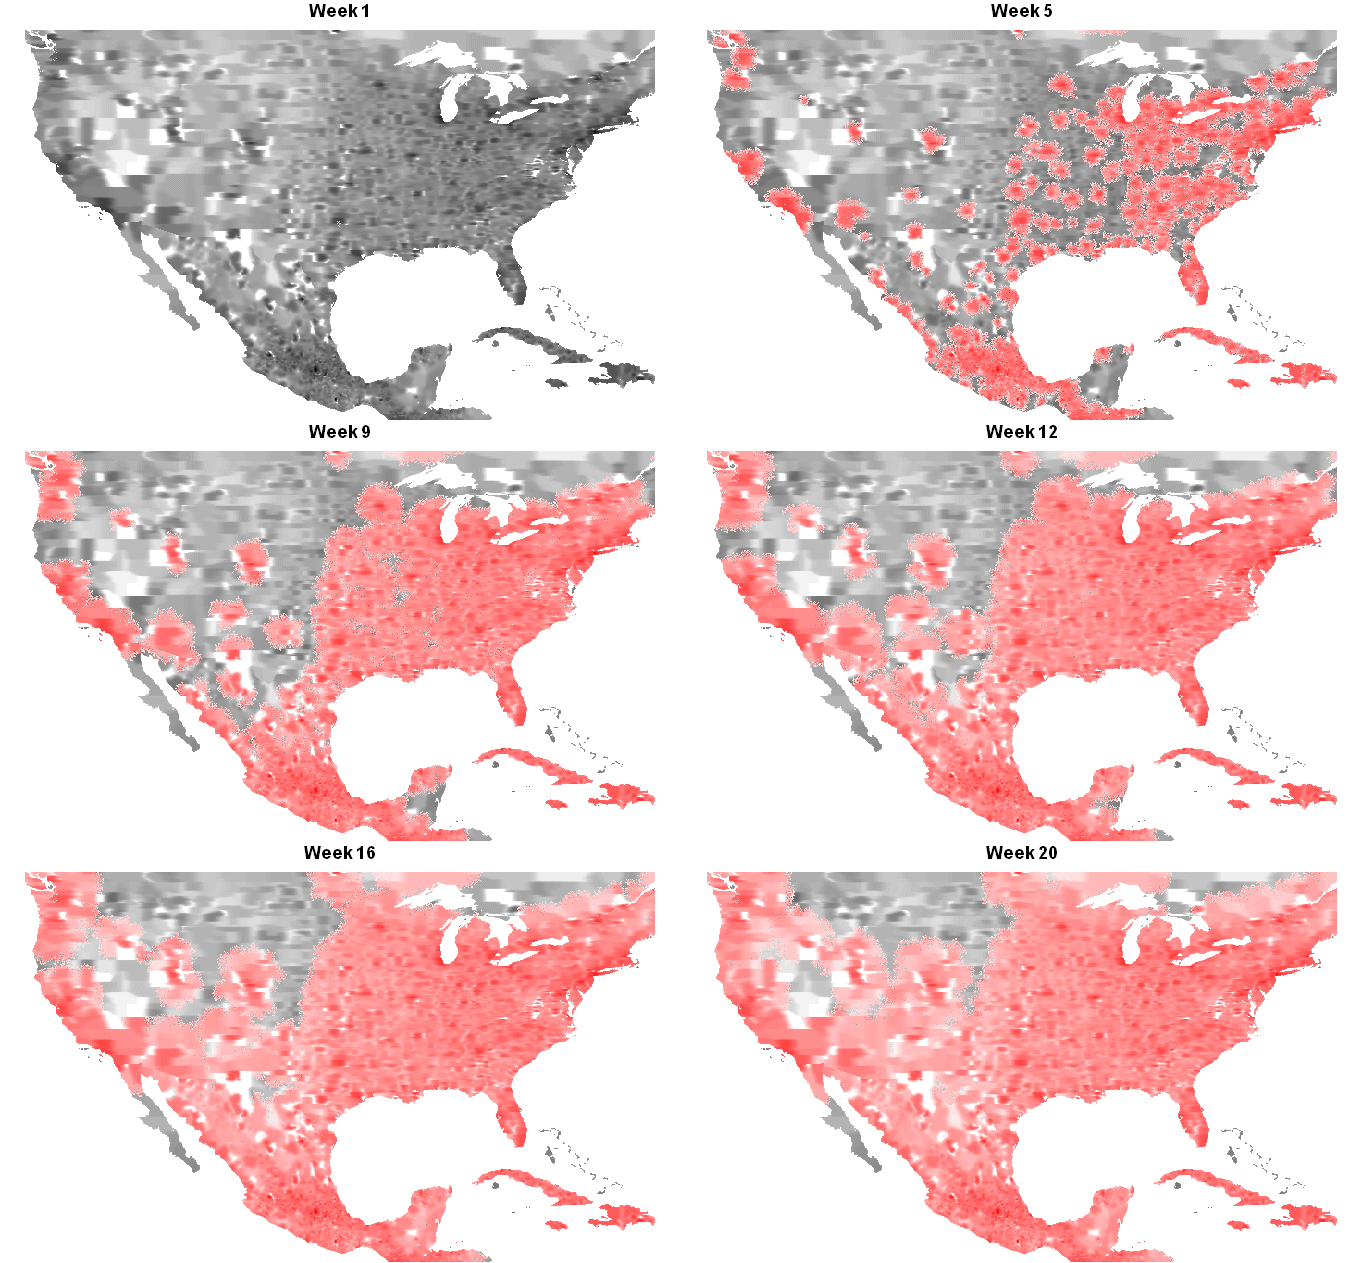
Spread of an Influenza Virus
|

|

The spread of flu has a strong mathematical basis. Serfling's model (
(Y=average mortality + trend + 52 week cycle + 26 week cycle + Error) or
(Y = a + b1t + b2cos(p t / 26) + b3sin(p
t / 26) + b4cos(p t / 26) +
b5cos(p t / 26) + E ) ), for instance, is used to estimate
levels of influenza. The Kermack-McKendrick
model (Susceptibles --rIS--> Infectives --qI--> Quarantines) can also
be used to model the spread of an epidemic. The animation shown here
involves a more complicated model showing an outbreak that originates in
Dallas, Texas. It was initially intended to see how
population density affects the spread, with factors like airports, roads,
and hospital overload thrown in. A detailed
description of the actual model used and its limitations is
available.
This animation was generating using code supplied by
Ed Pegg.
|


