Scientific Visualization with the Wolfram Language |
Maintained by Jeff Bryant |
| Intro | 2D Graphics | 3D Graphics | Hybrid Graphics | Animations |
Related Links
- Wolfram|Alpha
- The Wolfram Demonstrations Project
- Wolfram Functions Site
- MathWorld
- Wolfram Research
- Mathematica
- gridMathematica
- Mathgroup
- Mathematica Information Center
- Mathematica Yahoo Group
My Other Pages
| Previous 3D Graphic | Next Section |
GIS Data - Mars |

|
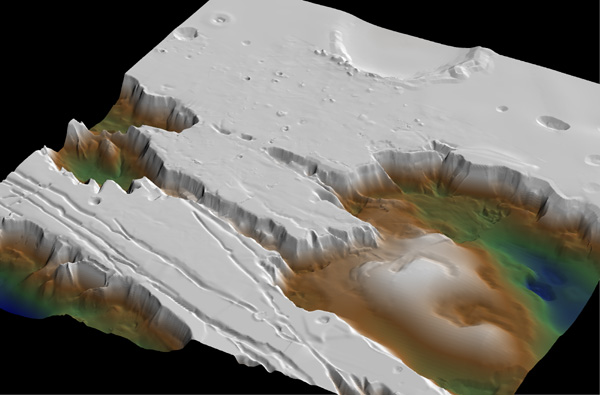
Mt. Saint Helens Landscape | Mars Landscape
This is another graphic demonstrating Mathematica's ability to import GIS data. In this case, the data represents a section of Valles Marineris, called Candor Chasma, on Mars. Data obtained from astrogeology.usgs.gov.